- Mike Titchen
- December 04th, 2017
Am I normal? Am I stable? Am I capable? These may seem like the wonderings of an insecure teenager; however, they are in fact three questions that are at the heart of Lean Six Sigma. So, next time you hear a Green or Black Belt ask whether they are normal, stable and capable, don’t worry – they are not referring to themselves, but to their process.
Every process creates outputs that will be used by the customer in some way, and every customer will have certain needs and requirements regarding these outputs. For example, if a customer is waiting for a parcel delivery, the requirement will relate to the delivery time. If the customer has been given a specific delivery slot, the customer will be expecting the delivery at that given time. However, most customers will be prepared to accept the delivery for a certain period of time around that delivery slot, for example, 120 minutes either before or after their stated time. In this case, the process output in question would be the number of minutes either earlier or later than the ideal delivery time.
Over many deliveries, the process will deliver parcels with more or less minutes either before or after the target time. This represents the variation in the process output and it is this variation in the process that the Green or Black Belt is referring to when they say, “Am I Normal, am I Stable, am I Capable?”
Am I normal?
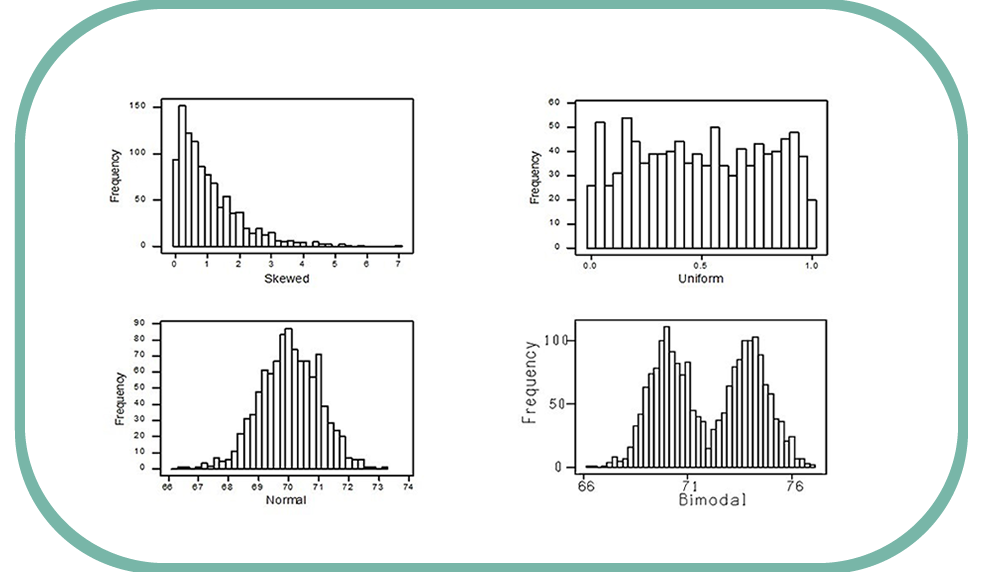
One way to represent this variation in the process output is by using a histogram. This enables the Green or Black Belt to see the shape of the distribution at a glance.
Below are a few examples of the process data displayed in this way:
The top left is an example of a skewed distribution. This occurs when the variation is all to one side. You might see this type of variation if you timed how long it took the phone to be answered in a call centre. The phone can’t be answered in less than zero seconds, but there can be a considerable delay if all the call centre agents are all busy – hence the skew.
The top right is a uniform distribution. This is where there is an equal chance of any outcome between a minimum or maximum. You should see this type of distribution when recording how frequently each number occurs on a roulette wheel.
The bottom right is where you have two distributions overlapping. You are likely to produce this type of histogram if you plot the weight distributions of a large group of adult women and men. Men tend to be heavier than women, although there is some overlap, and so this provides the two overlapping distributions.
The bottom left histogram is a typical example of ‘normal’ distribution. Normal, in this context, describes a particular shape that usually occurs in nature when there is random distribution around a central tendency. This data forms the characteristic bell shape that you may have heard statisticians refer to. This normal distribution suggests that there is only a single source of variation and, because the tails drop off in a dramatic fashion either side of the mean and the average is close to the target, it suggests low defect rates for the customer.
Of course, a normal distribution with low defect rates leads to higher customer satisfaction levels. So, now you can understand why Green and Black Belts are keen to ask, “am I normal?”
Am I stable?
As with ‘Normality’, ‘Stability’ also has a specific technical connotation. According to Walter Shewhart, a famous early 20th-century engineer and statistician widely considered to be the father of statistical process control, there are two fundamental types of variation in nature: ‘Common Cause’ variation and ‘Special Cause’ variation.
Common Cause Variation is the inherent variation that naturally occurs in any system. This variation cannot be avoided and it fits within the bell curve we just discussed. By its very nature, this variation can be predicted and allowed for during planning.
Special cause variation is imposed from outside the system, is unexpected and unpredictable. Defects that are a result of this type of variation cannot easily be allowed for during planning without the inclusion of massive and wasteful contingency.
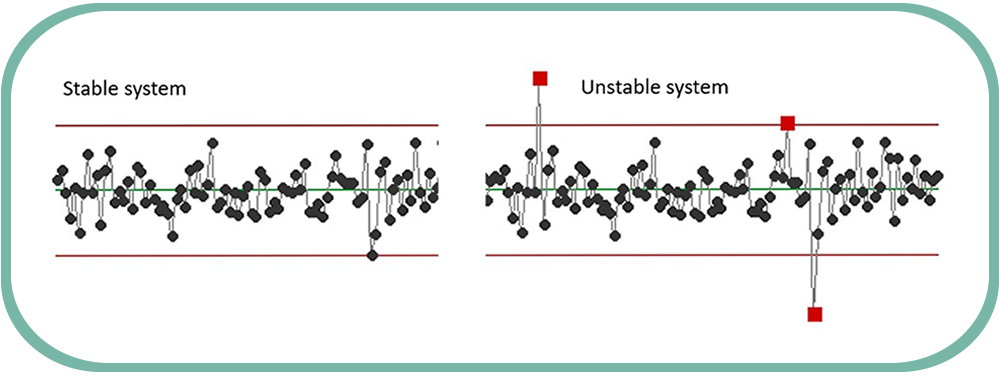
Shewhart deemed Systems that only exhibit Common Cause variation as ‘Stable’ and those that exhibited both common and special cause variation he called ‘Unstable’. In the case of our delivery example, a Stable process would involve the day-to-day fluctuations in traffic, whereas an unstable system will involve special cause variation such as breakdowns or accidents which are likely to lead to late deliveries. In short, a stable process is predictable and less likely to result in customer issues or complaints, and so that is why Green and Black Belts are so keen on knowing whether their process is stable.
The tool Walter Shewhart invented to see what type of variation a process is exhibiting is the Control Chart. Control Charts are essentially time series plots with limits created by the process itself – for the mathematically minded among you, the limits are at +/- 3 standard deviations. Below we have an example of two control charts, with a stable system on the left and an unstable one on the right.
Am I Capable?
The final question the Green or Black Belt is interested in answering refers to ‘Capability’. Capability, in this context, refers to the ability of a process to produce outputs acceptable to the customer. When a Green Belt or Black Belt carries out a capability study, they gather data on the process output and will then compare it to the customer expectation to see what proportion of the outputs fall within or without customer expectation.
Going back to our delivery example, we determined that a customer would accept a variation of up to 120 minutes either side of their preferred delivery time. For example, if they have an expected delivery time of noon, they will accept an alternative time between 10am and 2pm.
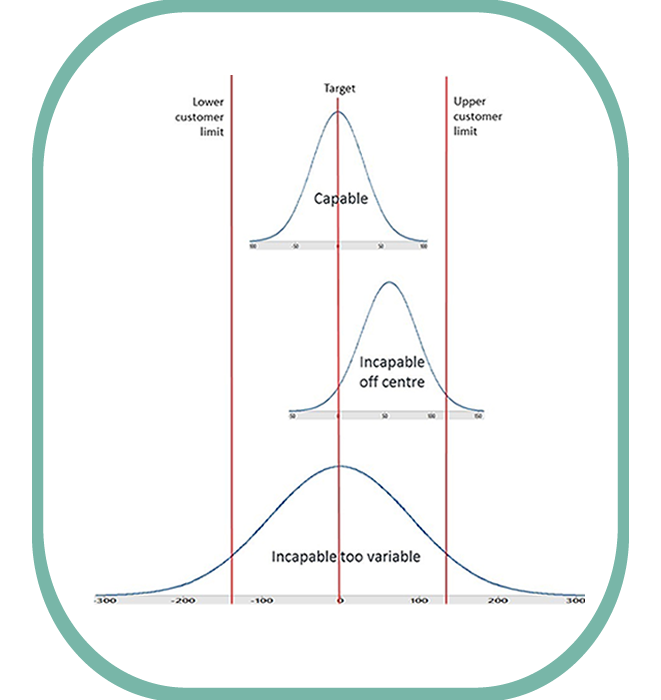
To determine capability, the process is often expressed in a figure such as the ones below:
Here you can see the variation of the process, represented as a blue bell curve, and easily compare it to the customer’s accepted amount of variation, represented here by the red bars.
As you can see, there are three examples of different delivery processes. The top example is a capable process, as the bell curve fits comfortably within the customer limits and so is highly unlikely to cause any customer issues. On the other hand, the middle example shows the same amount of variation in the process but, as it is to one side of the customer expectations, this process will generate customer issues and is therefore deemed incapable. The bottom example shows a delivery process that, on average, is on target. However, the variation around this average is too high with numerous defects at both the high and the low end, and so is also incapable.
Achieving a normal, stable, and capable process
So, in summary, a normal, stable, and capable process will have some variation but it will be predictable and within the customer specification limits. By achieving this, Green and Black Belts can be confident that the have a process that achieves low defect rates and high levels of customer satisfaction.
Hopefully, this insight has armed you with a greater understanding of what we mean by Normal, Capable and Stable and you will no longer worry when you hear your colleague questioning, “Am I normal, am I stable, am I capable?” In fact, you may even offer to assist in their Lean Six Sigma project!
If you are new to Lean Six Sigma and this insight has sparked an interested, why not click the button below and take our FREE introductory Lean Six Sigma White Belt course?


