- Jules Attard
- December 02nd, 2014
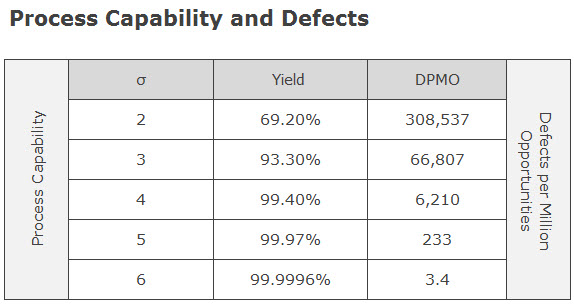
One of the most common confusions for student belts, and even many experienced Lean Six Sigma professionals, is the calculation of process capability using Sigma Level. Many will be familiar with a table like the one shown below, which shows the yield of a process for different process capabilities expressed in Sigma scores.
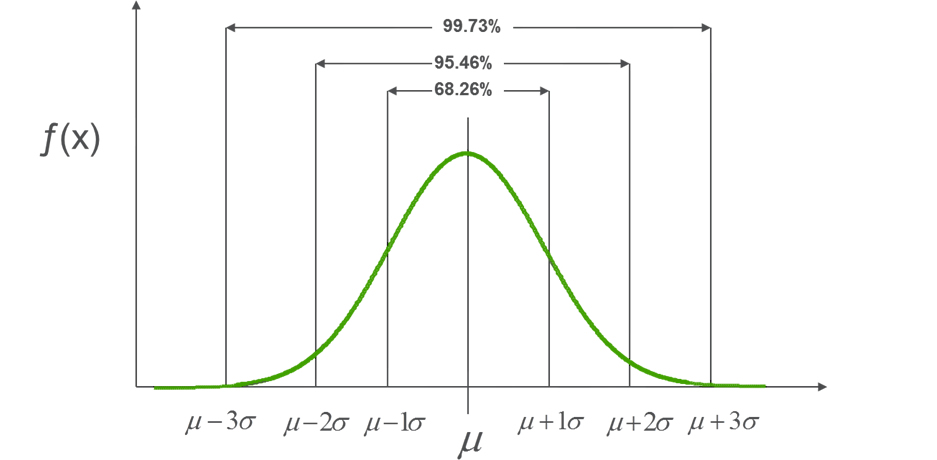
However, when they recall the properties of the normal distribution, they note that 99.73% of the data falls within 3 standard deviations of the mean (see graph below).
Normal Distribution
In other words, if you put a specification limit on a process at plus and minus 3 standard deviation from the mean, the yield would be 99.73% and the DPMO (defect rate) is 2700 – not 93.3% and 66,807 as stated in the table. So why is there a difference between what the table says and the standard deviation?
Well, 99.73% is the long-term process capability which would be observed if the process ran for a long time, and is the measure of whether the customer’s requirements are met. It is made use of in many LSS calculations; for example, the probability that a measurement on a control chart which falls outside the control limits (placed at +/- 3s) is special cause variation.
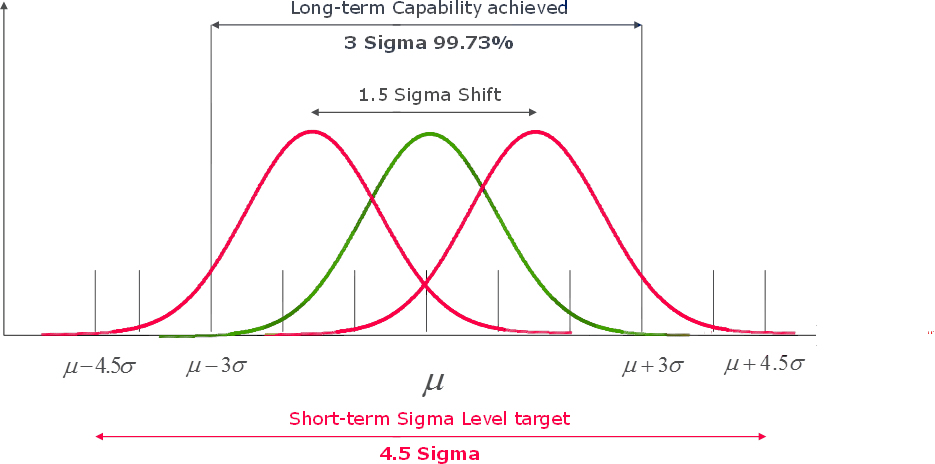
Far back in the mists of ancient time (the 1980s), the early practitioners of Six Sigma at Motorola analysed a sample of their processes and found that process capability tended to drift over time. In order to ensure the long-term process achieved a target defect rate, and recognising that they could only measure what was happening to their processes in the short term, they concluded that the short-term process needed to ‘fit’ more standard deviations between the mean and the specification limits, and decided that an additional 1.5 standard deviations was about right (on average). In other words, the short-term process capability needs to be 1.5 standard deviations better than the long-term in order to ensure the desired long-term capability is achieved. The ‘extra’ 1.5 standard deviations is known as the Sigma Shift.
Sigma Shift
When we report process capability, we report what we can observe, which is the short-term capability. So, to achieve a long-term yield of 99.73% (3s), you need to fit 4.5s between the mean and each specification limit in the short term. That’s why the table shows 4.5s (how a process needs to behave in the short term) against a yield of 99.73% (what you will achieve in the long term).
Is the 1.5 sigma shift justified? Since the original work was done, LSS practitioners have concluded that the size of the sigma shift depends on the industry and type of process being studied; however, the general concept – that processes drift over time, and short-term capability needs to be better in order to ensure a long-term capability goal is achieved – remains valid everywhere.


